
IMD as a predictor of children’s overweight status in Doncaster communities where there were more than 75 children measured.
Data for this analysis was provided in anonymised form from Doncaster Metropolitan Borough Council Public Health, who was the collaborator on this research application.
The aim of this research is twofold. Firstly to consider the predictors of rates of children who are overweight and obese at community level and to determine if there are contextual factors that contribute to these rates. Secondly, the research aimed to identify communities that were performing better than would be expected so that a qualitative case study could be undertaken to try to see what might be supporting their resilience.
The term resilience means the capacity to recover from difficulty and has been used in research on communities for some time in relation to their ability to recover from natural disasters (see Noris et al 2007). In this research the term seems apt, given that those who are overweight and obese are more likely to also experience diet-related illness (see, for example, Hawkes 2006) and there are links to poverty (see analysis below, but also Drewnowski and Spector, 2006, it should be noted that not all people who are classified as overweight or obese are in poor health, for example Julie Guthman’s 2011 book, Weighing In, offers a good analysis).
In England, where this study was conducted, fiscal austerity measures that are rolling back the ability of local authorities to support communities, neoliberal economic policies that are increasing the divide between wealthy and poor, and draconian welfare reform can be characterised as a disaster for communities that are poor. The Trussell Trust Food Bank Network reports that there are thirteen million people living in poverty in the UK today, and a recent report by the Joseph Roundtree Foundation highlights that the face of poverty is changing in the UK such that families in poverty are increasingly living in precarious circumstances, but are also those who are working. Bernardo’s, cites research by the institute of fiscal studies that indicates that child poverty in the UK is expected to rise. Furthermore, poverty tends to concentrate in particular communities, such that we see a geography of rich and poor where the north of England and parts of London have the highest concentrations of poverty (see this 2016 interactive map on The Guardian).
In families that are poor, strategies for coping include parents skipping meals to feed children, but also –and importantly–trading down on the quality and nutritional value of the food they buy. In short, low-quality food is less expensive, can be more filling, and can be stored for longer than food that is more healthy food. But low-quality food also tends to be higher in fat, salt, and sugar, which helps explain the confusing link between high rates of overweight and obesity and the food poverty (See Drewnoski and Spector for a scientific analysis (cited above); but also see this comment by Peter Marsh at the Social Issues Research Centre). Although this is not perhaps a natural disaster, certainly the toxic combination of poverty, a hollowing out of support, and a food system that is more geared toward profits than it is toward providing healthy food can be considered disastrous for the communities that are experiencing such hardship the most.
Evidence shows, however, that there are communities that are bucking expectations. The analysis presented in this report provides one way of identifying potential community resilience through a statistical analysis that focuses on residuals. Such analysis, when coupled with a qualitative investigation, can reveal new and perhaps better ways of approaching the duel problems of obesity and food poverty in the short term at the scale of the local authority.
Results of the analysis
A standard regression analysis indicates that while the index of multiple deprivation (IMD) is a predictor of childhood obesity, it only predicts about 40% of the variance across Doncaster communities (See figure 1). The following graphs unpack this a bit more (figures 2 and 3).
Figure 1: Simple Linear Regression Statistic of IMD score as a predictor of percentage of overweight children
| Model Summary | |||
| R | R Square | Adjusted R Square | Std. Error of the Estimate |
| .643 | .413 | .401 | .031 |
| The independent variable is IMD_score. | |||
| ANOVA | |||||
| Sum of Squares | df | Mean Square | F | Sig. | |
| Regression | .033 | 1 | .033 | 33.811 | .000 |
| Residual | .046 | 48 | .001 | ||
| Total | .079 | 49 | |||
| The independent variable is IMD_score. | |||||
| Coefficients | |||||
| Unstandardized Coefficients | Standardized Coefficients | t | Sig. | ||
| B | Std. Error | Beta | |||
| IMD_score | .002 | .000 | .643 | 5.815 | .000 |
| (Constant) | .219 | .009 | 24.145 | .000 | |
The only other variables that have any predictive value are the education variables for adults (with L3 and L4 and with L4) and those predictions were similar to the IMD rates. This is not surprising given educational attainment is one of the variables considered when producing the IMD score. Two further variables provided by the council, percent non-white and percent of children with a fast-food takeaway within 1km, were not significant in their ability to predict levels of children who are overweight. Specifically, with regard to fast food access, the results of the regression are not significant in this analysis (R2 = .044, F=.092, Sig=.763).
Figure 2 is a scatter plot of communities reported percentages of children who are overweight. There is a positive relationship between children who live in poverty and overweight status as demonstrated by the linear regression statistics. One can see that Finningley, an area with a low deprivation score, is also the community with the lowest percentage of overweight children (18%), whilst Skellow, an area that is not one of the highest areas of deprivation has the highest percentage of overweight children (36%). At the other end of the plot we can see Denaby Main is an area of high deprivation with a high percentage of overweight children (31%). Given that the locations on the right of the graph are more deprived, we would expect to see these communities to have higher percentages of children being classed as overweight compared to those communities on the left side of the graph.
Figure 2: Observed percentage of children who are overweight by community and Index of Deprivation score
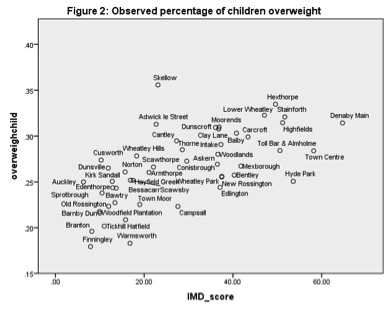 While it might be tempting to stop the analysis with this graph, two further graphs are useful to look at as they indicate how much of this obesity can be explained by the Index of Deprivation, remembering that the model explains just over 40% of the variation between communities.
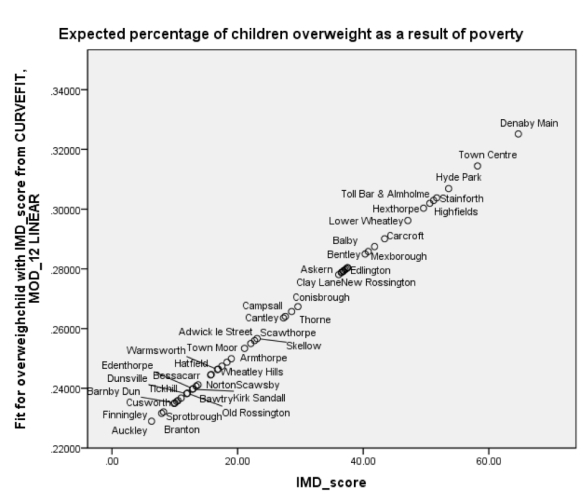
Figure 3 provides the predicted values for each community based on their index of deprivation score. For example, we would expect approximately 33% of children living in Denaby Main, the most deprived area, to be overweight whereas approximately 23% of children in Auckley, the least deprived area, would be overweight.
Figure 3: Predicted percentages of overweight children by community
Residual values for each community (difference between expected value and real value) are presented in Figure 4.
Figure 4: Residual Plot of children who are overweight by Community
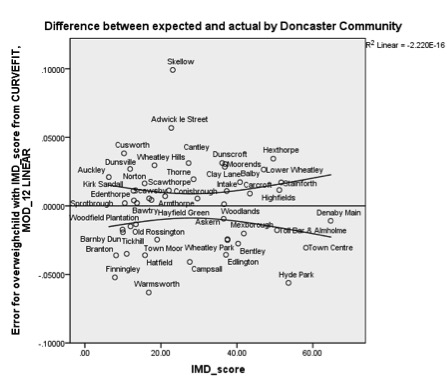 Moving from left to right, the IMD score for each community increases. What this graph tells us is that those communities below the bottom line have a lower than predicted proportion of children who are classed as overweight, whilst those communities above the top line have higher than predicted percentages of overweight children. The further the community is from the standard error lines (top and bottom lines) the less effective IMD score is for predicting percentages of overweight children.
This is illustrated by looking at individual communities. While Denaby Main is below the expected value, it falls within the standard error trough and as a result, conforms to the model (With 31% of children classed as overweight). Note also that both Highfields and Stainforth are also within the standard error range for the model. As such the IMD score is a very good predictor of overweight children for these communities. Comparatively, Hyde Park (25% overweight) and Edlington (24% overweight) are areas with relatively high deprivation scores, but exhibit significantly lower than expected percentages of children who are presenting as overweight (respective predicted percentages of overweight children are approximately 31% and 28%). An examination of the top half of the graph shows that Aukley, which should have the lowest rates of overweight children has a value that is higher than would be expected (25%) based on deprivation levels alone. Skellow is a particularly interesting case as it has a value (36%) that is not well predicted by the model, and in fact, a significantly larger percentage of children are identified as overweight than would be expected given its level of deprivation (the module predicts this value should be approximately 25 or 26%). Indeed, Skellow has rates of overweight children that are as higher than would be expected for the most deprived areas.
Looking again at fast food access as a predictor of residual values to see if perhaps access to fast food can help predict places that were performing better than expected shows that there was not a significant relationship (R2=.095, F=.439, Sig=.511). Indeed looking closely at individual communities also belies any predictive value of fast food access. The fact that Highfields, which has a rate of access that is 16%, is no more or less likely to present children that are overweight, than Stainforth, an area of similar deprivation but which has 91% of children with access to fast food. As such, policies that seek to introduce fast food exclusion zones around schools may not prove to be an effective measure (this conclusion is also backed up in a number of research studies as reviewed by Williams et al 2014), while at the same time may add burden to those groups of people who are concentrated into this form of employment.
Conclusions and recommendations
Taken together we can argue that IMD_score is a good predictor of percentage of children who are overweight . But it is important to pay attention to individual locations as poverty is not a good predictor in all cases. Doing a slightly more complex analysis that examines the residuals offers insight into community resilience.
Those communities with percentages of overweight children which are below the standard error lines are areas where some other intervening factor is helping children to avoid becoming overweight. Conversely, there is also some local factor that is driving a higher proportion of children into becoming overweight and this is not related to levels of deprivation in these places.
Interventions could proceed in a number of different ways.
- Firstly, interventions could target deprived areas, which would flatten out the graph in figure three. However, a note of caution, by linking of deprivation to obesity intervention further burdens those communities that are already targets of social welfare programmes and adds to the risk of programme fatigue for community members. This approach also further stigmatises the poor, while at the same time does not support those children and families in more well-off communities, many of which are clearly areas in need of intervention.
- Secondly, interventions can aim to reduce the overall rate of obesity in children. The model predicts that even the most well off areas as many as one-fifth of children will present as overweight and reducing this rate extends support across the spectrum of communities. The likely effect of such interventions would be to lower the predicted line. The danger with the approach is a one size fits all approach may not prove to be as effective in areas with working class culture and values if the programmes are perceived to be promoting middle-class values, cultures and aspirations and which do not take into account the specific circumstances of each community. Remember for example the attempts by Jamie Oliver to help healthy eating and the criticisms he received for being out of touch with the lives and experiences of low-income people.
- Thirdly, a targeted community approach could be introduced with programmes that may be the same in practice, but which are developed and presented in a language that reflects the values of each community. Acceptance and take-up may be higher if this were to be the case. The negative side of this is that such approaches are more complex to deliver and it may be harder to determine what works well without a clear and full knowledge of each community. Existing community organisations could help with this.
- Fourthly, a modified or stepped approach could be employed with different information and programmes that are tailored to different clusters of communities and which draw on existing community-based organisations and their expertise. In lower income communities, programmes could build on values held working-class families and acknowledge existing skills held by primary shoppers in these communities. For example by focusing on image and thrift in communities like Edington and environmental sustainability/animal welfare or food quality in more middle-class communities as a way to introduce healthy eating practices.
The follow-on research from this quantitative study suggests that community organisations play a very important role is in supporting community resilience. The research found in Edlington that there were two very active community groups that offer services that are providing benefits advice, supporting access to health care, reducing the need for medical treatment in the elderly through targeted programmes, cooking classes that support healthy eating, offering free meals and food parcels, redistributing surplus food using social media, and holding school holiday activity that include meals. However, despite this indicative case study, much more research is needed that documents the impact of community groups and how they support community resilience. Importantly these two organisations are community grown, rather than put in place by the local authority. This qualitative research should be replicated with similar research in other communities that are similarly showing resilience and also research in communities where the rates of obesity are higher than expected needs to be undertaken to understand if there is an absence of community-based support.
Finally, while these approaches are aimed at identifying and supporting resilience at a local authority level, the larger problem of poverty can be somewhat resolved by turning away from of neoliberal policy that supports the expansion and concentration of capital into the hands of the few and a rolling back of austerity measures that punish the poor while they shield the wealthy.
Funding for this research was provided by an ESRC IAA grant number: R/145185

Pingback: Doncaster Food Partnership | GeoFoodie
Pingback: Good Food: Feeding Affordance, Decent Helpings, and Community Resilience | GeoFoodie